Candlestick charts are a cornerstone of technical analysis in cryptocurrency trading, offering a visual representation of price movements over time. Originating in Japan centuries ago for rice trading, candlestick charts have become a universal tool for traders to analyze market trends, predict price movements, and make informed decisions. In the volatile world of cryptocurrencies, mastering candlestick charts is essential for navigating market fluctuations. This guide explains the fundamentals of candlestick charts, their components, common patterns, and how to interpret them effectively in crypto trading.
What Is a Candlestick Chart?
A candlestick chart displays price data for a cryptocurrency (e.g., Bitcoin, Ethereum) over a specific time frame, such as minutes, hours, days, or weeks. Each candlestick represents the price action within that period, showing four key data points: the opening price, closing price, highest price (high), and lowest price (low). These charts are popular because they convey complex price information in a visually intuitive format, allowing traders to identify trends, reversals, and market sentiment at a glance.
Anatomy of a Candlestick
Each candlestick consists of a body and wicks (also called shadows or tails):
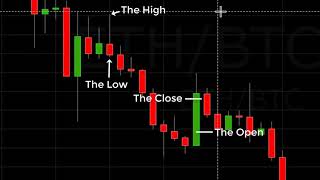
- Body: The thick rectangular part of the candlestick represents the range between the opening and closing prices. If the closing price is higher than the opening price, the body is typically colored green (or white), indicating a bullish (upward) movement. If the closing price is lower, the body is red (or black), signaling a bearish (downward) movement.
- Wicks: Thin lines extending above and below the body show the highest and lowest prices during the time period. The upper wick extends to the high, while the lower wick reaches the low.
- Open and Close: The open is the price at the start of the period, and the close is the price at the end. The body’s position relative to the wicks indicates market sentiment.
For example, in a 1-hour candlestick for Bitcoin, if the price opens at $60,000, closes at $61,000, reaches a high of $61,500, and a low of $59,500, the candlestick will have a green body (from $60,000 to $61,000), an upper wick to $61,500, and a lower wick to $59,500.
Time Frames
Candlestick charts can represent various time frames, from 1-minute candles for scalping to daily or weekly candles for long-term analysis. Shorter time frames (e.g., 5-minute or 15-minute) show more granular price movements, while longer time frames (e.g., daily or weekly) reveal broader trends. Crypto traders choose time frames based on their trading style—day traders prefer shorter periods, while hodlers focus on daily or weekly charts.
Reading Candlestick Patterns
Candlestick patterns are formations of one or more candlesticks that signal potential market movements. Recognizing these patterns helps traders predict whether prices are likely to rise, fall, or consolidate. Patterns are categorized into bullish, bearish, and neutral types. Below are some common ones:
Single Candlestick Patterns
- Doji: A Doji occurs when the opening and closing prices are very close or equal, forming a thin body. It signals indecision in the market and often precedes a reversal or continuation, depending on the preceding trend. For example, a Doji after a strong uptrend may suggest a potential reversal.
- Hammer: A bullish pattern with a small body near the top and a long lower wick. It indicates buyers pushed the price up after a significant drop, often signaling a reversal from a downtrend.
- Shooting Star: A bearish pattern with a small body near the bottom and a long upper wick. It suggests sellers overwhelmed buyers after an upward move, hinting at a potential reversal.
Multi-Candlestick Patterns
- Bullish Engulfing: A two-candle pattern where a small red candle is followed by a larger green candle that completely engulfs it. This suggests strong buying pressure and a potential uptrend.
- Bearish Engulfing: The opposite, where a small green candle is followed by a larger red candle, indicating selling pressure and a possible downtrend.
- Morning Star: A three-candle bullish reversal pattern with a short-bodied candle (often a Doji) between a long red candle and a long green candle. It signals a shift from a downtrend to an uptrend.
- Evening Star: A bearish counterpart to the Morning Star, indicating a potential reversal from an uptrend to a downtrend.
Interpreting Market Sentiment
Candlestick charts reveal market psychology. A series of green candles with small wicks suggests strong buying pressure and bullish sentiment. Conversely, red candles with long upper wicks may indicate sellers dominating after failed attempts to push prices higher. Large candlestick bodies signal strong momentum, while small bodies or Dojis reflect consolidation or indecision.
Combining with Other Tools
While candlestick patterns are powerful, they’re most effective when used with other technical analysis tools:
- Support and Resistance: Candlestick patterns near key support (price levels where buying typically emerges) or resistance (where selling occurs) are more significant. For instance, a Hammer at a support level strengthens the bullish signal.
- Moving Averages: These smooth out price data to identify trends. A Bullish Engulfing pattern above a rising 50-day moving average reinforces an uptrend.
- Volume: High trading volume accompanying a candlestick pattern confirms its strength. For example, a Bullish Engulfing with high volume is more reliable than one with low volume.
- Relative Strength Index (RSI): This momentum indicator helps identify overbought or oversold conditions, complementing candlestick signals.
Practical Tips for Crypto Traders
- Start with Longer Time Frames: Beginners should analyze daily or 4-hour charts to avoid noise from short-term volatility.
- Confirm Patterns: Don’t rely on candlestick patterns alone. Use volume, support/resistance, or indicators to validate signals.
- Practice Risk Management: Crypto markets are volatile. Set stop-loss orders to limit losses, especially when trading based on candlestick patterns.
- Backtest Patterns: Use historical data to test how specific patterns perform for a given cryptocurrency. Platforms like TradingView offer tools for this.
- Stay Updated: Crypto markets are influenced by news (e.g., regulatory changes, exchange hacks). Monitor X posts or news feeds to contextualize chart patterns.
Common Mistakes to Avoid
- Overtrading: Acting on every candlestick pattern can lead to losses. Focus on high-probability setups.
- Ignoring Context: A pattern’s significance depends on the preceding trend and market conditions. A Bullish Engulfing in a strong downtrend may be less reliable.
- Neglecting Fees: Crypto trading fees (e.g., on exchanges like Binance) can erode profits, especially for frequent traders.
- Emotional Trading: Stick to your strategy and avoid impulsive decisions based on short-term price swings.
Why Candlestick Charts Matter in Crypto
Cryptocurrency markets are driven by sentiment, speculation, and rapid price swings. Candlestick charts provide a window into these dynamics, helping traders identify entry and exit points. For example, spotting a Morning Star pattern during a Bitcoin dip could signal a buying opportunity, while an Evening Star during a rally might prompt a sell. By mastering candlestick charts, traders gain a structured approach to navigating the crypto market’s chaos.
Conclusion
Reading crypto candlestick charts is a foundational skill for traders. By understanding the anatomy of candlesticks, recognizing key patterns, and combining them with other tools, you can make more informed trading decisions. While patterns like Doji, Hammer, or Bullish Engulfing provide valuable signals, they’re not foolproof. Always consider market context, use risk management, and stay disciplined. With practice, candlestick charts can become a powerful ally in your crypto trading journey.